Yesterday I posted a short article whose main purpose was to show a figure I had received from Sven Heinemeyer, a phenomenologist who specializes in the study of Minimal Supersymmetric extensions of the Standard Model (MSSM).
Besides predicting a mirror copy of Standard Model (SM) particles, MSSM models are characterized by containing not just one, but five distinct Higgs bosons; over much of the space of possible parameters of these theories, one of the five Higgs bosons is quite similar to the one and only SM Higgs, so that one can discuss the SM Higgs and the lightest neutral scalar of the MSSM together without generating confusion.
Sven, who is a friend, is kind enough to periodically produce updated plots of the impact of the measured top quark and W boson masses on the unknown mass of the (lightest) Higgs boson. And he does it exactly the way I like -no frills, no extraneous information (such as indirect results on the W mass, which make the plot too crowded while adding information which most of us is willing to ignore), no individual measurements but actual world averages, and no silly projections to what a "giga-Z" or a "SLHC" promises to provide in terms of precision on the top quark and the W boson masses. And I pay him back as I can -by posting them here.
So allow me to show the plot again, because I am going to spend some time discussing it in detail below.
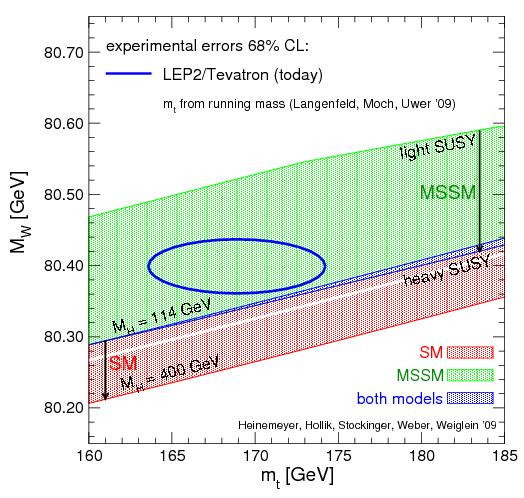
I of course realize that I am guilty of letting some of you down: space limitations force me to defer to the next article the nuts and bolts behind the inter-relation of top, W, and Higgs masses, which generates the upward parabolic curves of W mass versus top mass that you can see in the red region, each corresponding to a well-defined Higgs boson mass. Here you need to let me get away with just the following note on the plot: within the SM, a perfect knowledge of top and W masses would indicate the exact value of the Higgs boson mass, while more data -knowledge of the masses of SUSY particles, for instance- would be needed to get the same information in case of a MSSM Higgs.
Once we agree on that point, we can discuss in some detail what this particular version of Sven's series of "Mw-Mt" plots mean. As the most up-to-date of you have probably already noticed yesterday, in fact, the blue ellipse describing the present status of our knowledge of top and W masses looks really funny. What is the business with a top mass well below 170 GeV ? The Tevatron average says that the top mass is 173.1+-1.3 GeV...
Care with the Top pole mass
As I quickly mentioned yesterday, the top quark is not entitled to have a perfectly well-defined pole mass. Here is why.
The propagation of an elementary particle is expressed in quantum field theory by a "propagator" -duh-, a function of the particle's four-momentum, which has a pole (a value where it becomes infinite) for a specific value of four-momentum squared. The real part of the pole is what is called the particle's "pole mass".
While the above definition is exact for non-strongly-interacting particles which approximate the notion of a stable, "asymptotic" state, for heavy quarks -even "stable" ones- it is not so, because non-perturbative quantum chromodynamical processes affect the mass and make it ambiguous by an amount proportional to the energy scale of non-perturbative QCD effects, or . 200 MeV, give or take a few.
Now, the top quark is often thought to be "free from quantum chromodynamical (QCD) effects" despite being a coloured object (thus a source of QCD colour field, and so in principle all but decoupled from that interaction). The reason of that misconception is that physicists like to approximate, and they claim that since the top quark has a lifetime ten times shorter than the typical time scale at which QCD interactions act, there follows that the top quark is effectively "free", and that it can therefore be treated as if it were an asymptotic state.
A quite instructive 1997 paper by M. Smith and S. Willenbrock explains that while it is true that the top quark usually decays without having the time to radiate soft gluons or dress up in a colorless meson ("the top quark does not hadronize"), it is erroneous to believe that what we measure by reconstructing the energy of its bona-fide decay products is the true pole mass.
To use Smith and Willenbrock's words,
Besides predicting a mirror copy of Standard Model (SM) particles, MSSM models are characterized by containing not just one, but five distinct Higgs bosons; over much of the space of possible parameters of these theories, one of the five Higgs bosons is quite similar to the one and only SM Higgs, so that one can discuss the SM Higgs and the lightest neutral scalar of the MSSM together without generating confusion.
Sven, who is a friend, is kind enough to periodically produce updated plots of the impact of the measured top quark and W boson masses on the unknown mass of the (lightest) Higgs boson. And he does it exactly the way I like -no frills, no extraneous information (such as indirect results on the W mass, which make the plot too crowded while adding information which most of us is willing to ignore), no individual measurements but actual world averages, and no silly projections to what a "giga-Z" or a "SLHC" promises to provide in terms of precision on the top quark and the W boson masses. And I pay him back as I can -by posting them here.
So allow me to show the plot again, because I am going to spend some time discussing it in detail below.
I of course realize that I am guilty of letting some of you down: space limitations force me to defer to the next article the nuts and bolts behind the inter-relation of top, W, and Higgs masses, which generates the upward parabolic curves of W mass versus top mass that you can see in the red region, each corresponding to a well-defined Higgs boson mass. Here you need to let me get away with just the following note on the plot: within the SM, a perfect knowledge of top and W masses would indicate the exact value of the Higgs boson mass, while more data -knowledge of the masses of SUSY particles, for instance- would be needed to get the same information in case of a MSSM Higgs.
Once we agree on that point, we can discuss in some detail what this particular version of Sven's series of "Mw-Mt" plots mean. As the most up-to-date of you have probably already noticed yesterday, in fact, the blue ellipse describing the present status of our knowledge of top and W masses looks really funny. What is the business with a top mass well below 170 GeV ? The Tevatron average says that the top mass is 173.1+-1.3 GeV...
Care with the Top pole mass
As I quickly mentioned yesterday, the top quark is not entitled to have a perfectly well-defined pole mass. Here is why.
The propagation of an elementary particle is expressed in quantum field theory by a "propagator" -duh-, a function of the particle's four-momentum, which has a pole (a value where it becomes infinite) for a specific value of four-momentum squared. The real part of the pole is what is called the particle's "pole mass".
While the above definition is exact for non-strongly-interacting particles which approximate the notion of a stable, "asymptotic" state, for heavy quarks -even "stable" ones- it is not so, because non-perturbative quantum chromodynamical processes affect the mass and make it ambiguous by an amount proportional to the energy scale of non-perturbative QCD effects, or
Now, the top quark is often thought to be "free from quantum chromodynamical (QCD) effects" despite being a coloured object (thus a source of QCD colour field, and so in principle all but decoupled from that interaction). The reason of that misconception is that physicists like to approximate, and they claim that since the top quark has a lifetime ten times shorter than the typical time scale at which QCD interactions act, there follows that the top quark is effectively "free", and that it can therefore be treated as if it were an asymptotic state.
A quite instructive 1997 paper by M. Smith and S. Willenbrock explains that while it is true that the top quark usually decays without having the time to radiate soft gluons or dress up in a colorless meson ("the top quark does not hadronize"), it is erroneous to believe that what we measure by reconstructing the energy of its bona-fide decay products is the true pole mass.
To use Smith and Willenbrock's words,
"Such a short lifetime means that the top quark decays before it has time to hadronize. The large top-quark width can act as an infrared cutoff in the calculation of physical quantities, insulating the top quark from the effects of nonperturbative QCD."
"Motivated by these facts, we ask whether the top quark pole mass is free of the ambiguities associated with nonperturbative QCD. The purpose of this article is to demonstrate that this is not the case."
The point that the authors of the 1997 paper make is that while the top quark, taken alone, does produce exactly just a b-quark and a W boson, and that both those particles can be measured with good precision and no ambiguity in a collider detector, the picture is incomplete. The correct diagram to draw is not the simple one shown on the left in the figure below, but the much more complex one shown on the right.
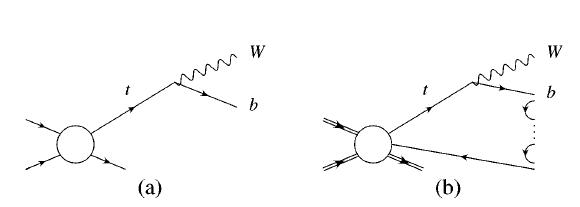
In the graph labeled "(b)" you see why the top quark can never be "taken alone": it is always color-connected by a coloured line passing through the b-quark and the other quarks participating in the b hadronization, with another quark produced somewhere else by the collision, and perfectly oblivious of the kinematics of top decay. This fact manifests itself in the uncertain energy of the b-quark jet, because the jet of colourless hadrons produced by the b-quark hadronization forcefully contains a quark which is coming not from the top quark, but from some other player in the interaction. This in turn leads to a uncertainty in the measured top mass, when one computes it using the kinematics of the W boson and the b-quark jet that the top quark has decayed into.
To summarize, there is an ambiguity, which is in fact of the order of
The running top mass
There is another definition of the top quark mass of which I wish to make you aware, in case you are not. This is the "running" mass -a mass whose value changes with the particle's energy. I will try to explain what that means in simple terms below.
Heavy quarks are studied by producing them in high-energy particle collisions. At such energies, the strong force is considerably weaker than at low energy: that is because we are probing these quarks at a shorter distance (since collision energy can be pictured as the inverse of the probe's wavelength), and by doing that we are overcoming part of the "anti-screening effect" of the colour field around the quark. Anti-screening arises because a colour charge polarizes the medium around itself, effectively becoming surrounded by virtual gluons. Gluons are themselves sources of the colour field, such that from a distance, one sees a larger colour charge than that of the actual source! If one uses a high-energy probe and wades inside the forest of virtual gluons, however, the effective colour charge one sees from the source is smaller. That is precisely the reason for the dependence of the strength of QCD interactions with the energy at which those interactions act.
Ok, so we have a "running" strong coupling constant. Its exact dependence on the energy of the interaction contains a free parameter, which is called "renormalization scale". In short, this is a cut-off for the calculation of divergent integrals in some of the virtual diagrams contributing to the strength of the interaction. The renormalization scale of a process is a quantity that affects all theoretical calculations of quantities that can be measured in that process.
Now, theorists have found out that re-defining the mass of heavy quarks in a way that makes them dependent on the renormalization scale, their perturbative calculations of processes involving these quarks become less uncertain and better defined. So they use a value of the top mass which depends on the energy scale at which the process is studied, and they talk about "short-distance masses".
For all practical purposes, experimentalists need not bother about these details: they just need from theorists a prediction for the value of observable quantities, and observable quantities are of course independent on the choice of the renormalization scale or other parameters. So, as an experimentalist, I am actually happy to not have to mess with the running top quark mass; however, when the running top quark mass is the means through which a better measurement of the top pole mass can be obtained, I become all ears.
The study in hep-ph/0906.5273
After the long babble above, which had the purpose of making a clumsy attempt at defining what is meant by "top pole mass" and "running top mass", I can get closer to explaining what is the input to Sven's plot above.
A couple of weeks ago U.Langenfeld, S.Moch, and P.Uwer have produced an important study which shows how, from the measured cross-section of top pair production at the Tevatron, a value of the running top quark mass can be obtained.
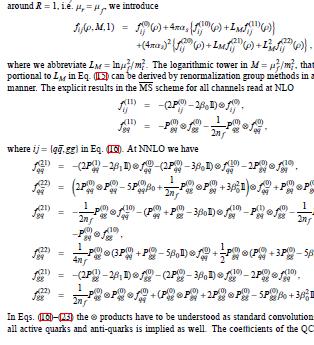 Today, as I was reading the work of Langenfeldet al. to report about it here, it occurred to me that if I did I would be really getting closer to speaking about things I do not understand well than I feel comfortable with: after all, the paper in question is extremely technical (check the snapshot on the right if you do not believe me)! So I decided to ask Sven if he would offer the authors of that study to do it in my place, in a guest post. Pending an answer (hopefully positive) to my request, I will just summarize the result of their study in the remainder of this article. I think this is fair, given the already biblical length that it has reached.
 A dependence of the cross section for top production on the top mass is not anything new: we know that the heavier an elementary particle is, the harder it is to produce it in a hadron collision, and we also know the main reason for it: the decreasing probability of finding quarks with suitable energy to give rise to that reaction inside the colliding hadrons. These are the so-called "parton distribution functions", which should not be unfamiliar to anybody who has read this blog for long enough.
There exist several precise calculations of the top pair production cross section at the Tevatron. In hep-ph/0906.5273, however, the authors have computed the cross section including some specific terms which depend on the factorization and renormalization scale more accurately than in the past, to an accuracy called "next-to-next-to-leading order" (NNLO). The inclusion of precise scale-dependent terms allowed them to make use of the measured cross-section of top quark pair production to determine the value of the running top mass, and from it, to arrive at a new determination of the top pole mass (which can be easily obtained from the running mass): this is nearly orthogonal information to what the Tevatron has produced on the top mass so far, because the top quark mass measurements by CDF and DZERO use the final state of top quark decay, rather than the production phase of top pairs!
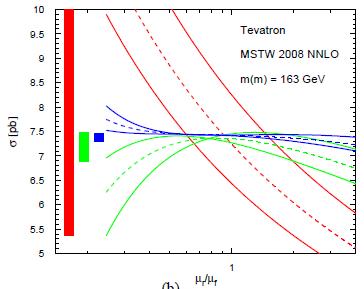 Moreover, the new work allowed the authors to find out that the residual theoretical uncertainties on the running top mass are quite small, and that a 10% uncertainty in the pair production cross section available from the CDF and DZERO production rate measurements converts to a quite appealing 2% uncertainty on the running top mass. For example, the figure on the left shows how the computed top pair production cross-section varies as a function of the choice of renormalization and factorization scales, when the cross section is evaluated by using leading-order approximation (in red), next-to-leading order approximations (in green), and NNLO approximations (in blue). The rectangles on the left span the cross section uncertainty at LO, NLO, and NNLO. At NNLO, there is almost no more dependence on the ratio of scales! This is a very appealing result: perturbative expansions performed with a grain of salt may cancel part of the scale dependence in the results.
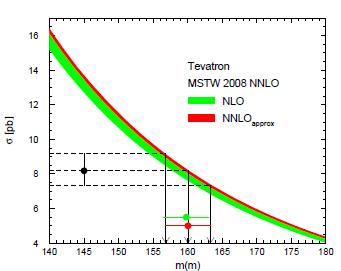 The figure on the right, also taken from the paper by Langenfeld et al., shows the dependence of (almost-exact) NNLO top pair production cross-section on the running top mass. The experimental determination on the cross section is shown by the two horizontal lines at 7.2 and 9.1 picobarns: they hit the functional form extracted at NNLO by the authors at specific mass values, which bracket the new running mass measurement: the result found is
 So that, finally, is what really enters in the plot I posted at the top of this post: the 168.2 GeV top pole mass extracted from Tevatron cross section measurements. If you go back to the top of this article, you can see that the blue ellipse is quite wider than earlier issues of the same figure (see here for the one produced in March this year): that is because the direct determinations of the top pole mass at the Tevatron have by now a 0.7% total uncertainty; also, the top mass value found by using the top cross section turns out to be significantly lower, although compatible within error bars.
The above is significant, new information, which of course is bound to arise the interest of Supersymmetry fans: in fact, as the top quark mass becomes lower, the Higgs boson mass predicted by the Standard Model theory also decreases, reaching down further in the region where the LEP II experiments have already excluded its existence.
Appendix: Some additional notes about the MW-MT plot
Besides the location and size of the blue ellipse, there are a dozen of additional questions that an inspection of the new MW-MT figure causes. Let me list them in random order as an add-on to the above article. If your favourite question is not in the list below, please use the comments box below and shoot.
1) What exactly does the blue ellipse mean ? Is it a 1-sigma interval in both mass measurements ? It looks wider than that...
The ellipse is centered on the world average W boson mass, and on the top quark pole mass as estimated from the running mass, as I have described above. The horizontal and vertical extensions of the ellipse do not correspond to 1-sigma variations: they are made in a way that the ellipse encompasses an area which has globally a 68% chance of containing the real value of those two quantities, given the experimental uncertainties on the measured values. To capture 68% of a two-dimensional Gaussian distribution you have to extend in each direction to more than one standard deviation, because one standard deviation would mean taking all the possible values of one of the two values, if the other lays between -1 and +1 sigma.
2) Why do the green and red areas overlap only marginally ? Does that mean that MSSM and SM can be distinguished by the observed mass of the lightest neutral Higgs boson ?
Both the Standard Model and Supersymmetry theories may live with a lightest neutral scalar particle just above the LEP II bound of 114.4 GeV. However, if the Higgs is much heavier -say above 135 GeV- SUSY becomes inconsistent, while the SM is still good. In that sense, excluding a neutral Higgs boson below 135 GeV will put in a significant embarassment all SUSY phenomenologists, including Sven :)
3) I understand that the red area encompasses possible solutions within the Standard Model of particle physics, still not ruled out by experimental searches, and that they correspond to different masses of the Higgs boson, which varies from light to heavy as we get farther from the top boundary of the area. But what exactly is the meaning of the green area instead ? Is that a function of the Higgs mass too ?
The plot is in truth slightly deceiving, but it has become customary to summarize in it two concurrent theories in two different ways: one model -the SM- is shown as a function of the Higgs mass, and another class of models together -the many MSSM alternatives- as a (loose) function of the supersymmetric particle masses. As you move down from the upper boundary of the green area you are hypothesizing larger and larger SUSY particle masses, but this does not correspond to a clear variation of the Higgs boson mass. In fact, all MSSM models require the lightest neutral Higgs boson to have a mass smaller than about 135 GeV: above that value, the theories are inconsistent; no combination of the many parameters of supersymmetry is capable of enabling the lightest Higgs boson to be heavier than that. So much so, that theorists have invented a ad-hoc scenario, the so-called Mh-max one, to see just how much breathing air SUSY had once the LEP II experiments started excluding Higgs masses above the Z mass.
4) When will the W boson and top quark mass be measured with an accuracy sufficient to measure the Higgs boson mass to an accuracy of a few tens of GeV ? Which of the two masses is more important in this respect ?
The dependence of the Higgs mass on the top and W masses is only logarithmic, as I plan to demonstrate in detail in the next post. The exact functional dependence implies that one needs to measure accurately both W and top masses to have some information on the Higgs. Now, while the W mass has been measured with a precision exceeding a part per two thousand, the top mass is only known within seven parts in a thousand. This does not mean that we must stop measuring the W mass and concentrate on the top mass, however: quite the opposite! In truth, the top mass has by now almost stopped delivering further constraint on the Higgs mass from the formula describing their interplay, as soon as we reached a 1% accuracy. The W mass is now all that matters. This is actually evident if you examine the plot more closely: the curves describing different values of the Higgs mass in the red area are almost horizontal, which means that by increasing the precision of the top mass one does not gain anything. It is only by narrowing the band of allowed W masses that one constrains the Higgs nowadays. So, cheer up: the CDF experiment is about to release a new W mass measurement, which will be the best in the world, and provide a total uncertainty on the W mass probably smaller than a part in four thousands!